The flat line is the exploit
A flat SOC dashboard can be defense evasion, not a quiet network. How APTs shape telemetry to land in a pipeline's discard paths, and why the graph is the IOC.
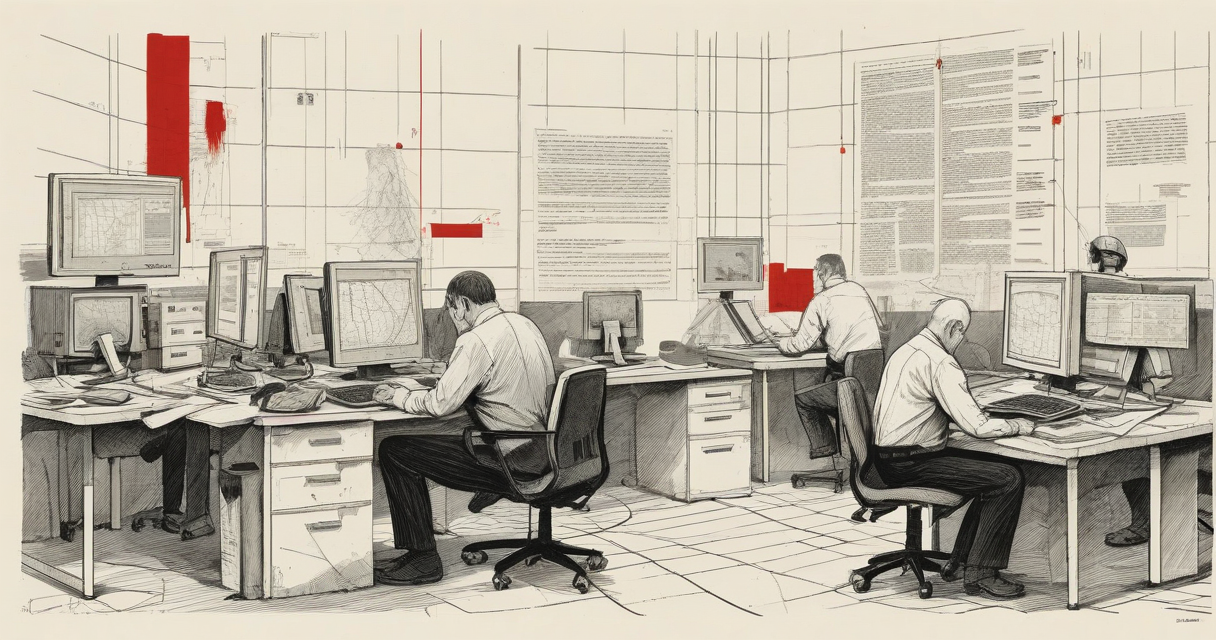
A SOC dashboard rendering a flat line across thirty days is not proof of a quiet network. It is proof that the pipeline feeding the graph produced a flat line. Those are different claims. The graph is a rendered artifact - the terminal output of an aggregation chain with a dozen lossy stages between the packet on the wire and the pixel on the wall. Analysts read the pixel. They rarely audit the chain. That gap is the vulnerability, and it is not in the visualization library. It is in the training.
The mechanism starts at collection and degrades at every hop. A telemetry pipeline is a sequence of lossy transforms: sensor, forwarder, parser, normaliser, index, query, aggregation, render. Each stage discards data by design. The forwarder samples under load. The parser drops fields it cannot match. The index tiers old events into cold storage the default query never touches. The aggregation layer buckets events into time windows and rolls them up. The render layer truncates to top-N and caps cardinality. By the time the line reaches the wall, it has passed through six stages that each threw data away. The line is not the network. It is a heavily compressed assertion about the network.
An adversary who understands that chain does not need to defeat a sensor. The sensor can fire perfectly. The evasion happens downstream, in the stages that summarise. The exploit primitive here is not use-after-free or type confusion. It is the lossy stage - every threshold, sample rate, and rollup window is a discard path, and activity shaped to land in the discard path never reaches the analyst. This is defense evasion, and it maps cleanly. MITRE T1562, Impair Defenses. T1562.006, Indicator Blocking. T1562.008, Disable or Modify Cloud Logs. T1070, Indicator Removal on Host. T1070.006, Timestomp. T1001, Data Obfuscation. None of these require touching the dashboard. They require touching what feeds it.
Volume shaping is the first technique. Forwarders sample under high event rates - Cloudflare’s analytics sample requests above a volume threshold, and most SIEM forwarders drop to 1:100 or lower when the queue backs up. Activity held below the sampling floor is statistically invisible in the aggregated count. The events exist in raw storage. They never surface in the rollup the dashboard queries.
Time-bucket smearing is the second. Dashboards aggregate into fixed windows - one minute, five minutes, one hour. A correlation rule fires when a bucket crosses a threshold. Cobalt Strike sleep and jitter, tuned through a malleable C2 profile, spreads beacon callbacks so no single bucket crosses the count. The beacon interval is matched to the aggregation window. Ten thousand callbacks a month, none of them clustered, render as baseline noise. The graph stays flat because the burst was smeared into the average.
Top-N eviction is the third. A network dashboard renders the top ten talkers by bytes transferred. An exfiltration channel that stays at rank fifteen never renders. The data leaves. The pixel does not move. Cardinality caps extend the same principle. SIEMs drop high-cardinality dimensions to protect index performance. Rotating source ports, subdomains, or identities fragments an adversary’s activity into thousands of single-count rows, each one below the display threshold, each one evicted before it reaches the visualisation.
Field coercion is the fourth. A parser expects a schema. Data that violates the schema - malformed encoding, oversized fields, unexpected Content-Type - gets routed to an unparsed catch-all index that no one builds a panel against. The event is retained and invisible in the same motion. A rising unparsed count is telemetry being lost, and lost telemetry is exactly where activity hides.
The fifth is suppression, and it is the one that should be front-page news. Timestomp writes events with timestamps outside the active query window. Log source disablement stops the source entirely. The Okta System Log going silent for a tenant, the Windows Security channel disabled on a domain controller, a CloudTrail trail stopped in one region - these do not spike the graph. They flatten it. And a flat graph reads as calm. The single most exploitable property of a SOC dashboard is that absence and safety render identically. A line that went quiet and a network that is quiet produce the same pixels.
The field-tested campaigns did this at scale. SUNBURST blended C2 into legitimate SolarWinds telemetry, used domain-generation-algorithm subdomains, and jittered beacons specifically to sit under volumetric thresholds - dwell time measured in months, on instrumented networks, with SOCs watching. APT29 did not defeat the sensors. They defeated the aggregation. Volt Typhoon operated living-off-the-land, no dropped binaries, activity shaped to match administrative baselines, generating almost no net-new telemetry against which a threshold could trip. The common property across both is not sophistication of implant. It is understanding of the defender’s summarisation pipeline and the discipline to stay inside its blind spots.
Telemetry reality is that nothing fires. That is the design objective, achieved. The correlation rules never trip because the inputs never cross threshold. There is no Sysmon Event ID 10 flagged as anomalous because the LSASS access was rate-limited under the alert floor. There is no EDR category raised because the volume stayed baseline. The dashboard is green. Green is the finding. What an analyst should instrument sits one layer beneath the panel everyone watches.
Log source health is the first control. A source going silent is an event. Most SOCs alert on volume spikes and have no rule for volume drops, which inverts the actual risk - the dangerous condition is the source that stopped talking, not the one that got loud. Ingestion volume baselines per source and per index catch the same class. A sustained fifteen to thirty percent EPS drop with no matching change-control record is an indicator of compromise, not a capacity anomaly. Parser failure rates catch coercion - a climbing unparsed ratio means data is falling out of the pipeline before it can be analysed. Raw event review catches smearing and truncation - pull the raw events for a window and count them independently of the dashboard’s rollup, because the rollup is the thing under manipulation. And cardinality awareness catches eviction - an analyst has to know what the dashboard truncates and query below the fold, because the top-N panel is structurally incapable of showing what it dropped.
The residual exposure does not close with a patch, because there is no version boundary here. Every SIEM tuning cycle that suppresses noise to reduce alert fatigue simultaneously defines a channel an adversary can occupy. The threshold that stops a false positive is the same threshold an operator shapes traffic to stay under. This is a permanent property of lossy aggregation, not a bug to be fixed. The graph is a compression of reality with a defined loss function, and the loss function is public - it is the documented sample rate, the configured bucket size, the top-N limit in the panel definition. An adversary reads those values the same way a defender does.
The correction is analyst training and pipeline instrumentation, not a new visualisation. A graph is not evidence. It is a claim about evidence, produced by a system with known discard paths, any of which can be occupied deliberately. The manipulated visualisation is itself the indicator of compromise - the flat line that should have noise, the source that went quiet, the baseline that dropped and stayed down. Reading the render as ground truth is the trained reflex that gets exploited. The pixel is downstream of six places to hide. Treat it as one.
Keep Reading
 threat-intel
Locale decides the payload
The en-GB locale isn't a vulnerability - it's a selector. How attackers use Accept-Language and OS locale checks to filter delivery and gate detonation.
 vulnerability-research
XBOW topped HackerOne in 2025 and fixed nothing
Vulnerability research rewards finding, not fixing. Exploitation tracks disclosure, not the flaw. Why attackers react to reported CVEs, and where telemetry goes blind.
 vulnerability-management
The copy runs past the allocation, again
Recurring dystopian tech vulnerabilities persist because defenders patch the CVE instance and never hunt the underlying mechanism. The inaction is the vuln.
Stay in the loop
New writing delivered when it's ready. No schedule, no spam.